


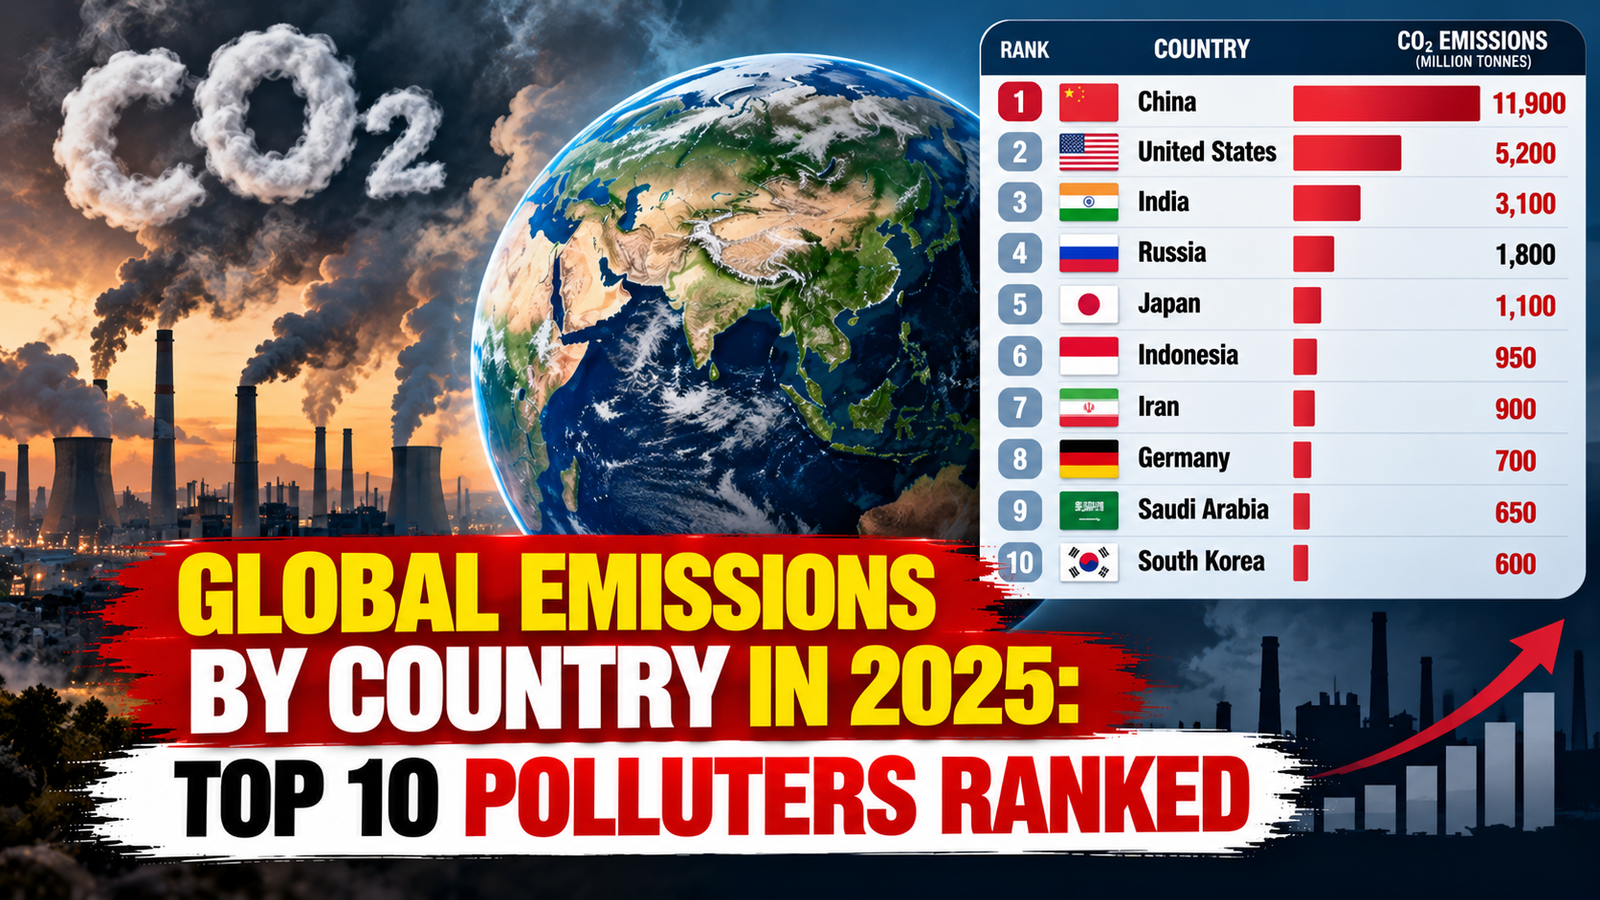
Global greenhouse gas emissions remain a major challenge in the fight against climate change. A new ranking of global emissions by country in 2025 highlights the countries responsible for the largest shares of worldwide greenhouse gas emissions. China leads the list, followed by the United States and India.
According to data published by Visual Capitalist, using the European Commission’s Emissions Database for Global Atmospheric Research (EDGAR), the three largest emitters together account for more than half of global greenhouse gas emissions.
The figures highlight the importance of energy production, industrial activity, transport, and economic growth in shaping the global climate challenge.
Global Emissions by Country in 2025: Key Highlights
Here are the main findings from the 2025 country ranking:
- China ranks first, contributing approximately 30.3% of global greenhouse gas emissions.
- The United States ranks second, accounting for around 11.4%.
- India ranks third, with an estimated 8.5% share.
- China, the United States, and India together account for approximately 50.2% of global emissions in this ranking.
- The five largest emitters—China, the United States, India, Russia, and Indonesia—account for nearly 58% of the total.
These percentages refer to the ranking’s reported greenhouse gas emissions, not just carbon dioxide emissions from fossil fuels.
Top 10 Countries by Greenhouse Gas Emissions in 2025
The following table summarizes the top 10 countries and their reported shares of global emissions.
| Rank | Country | Emissions (Mt CO₂-equivalent) | Share of Global Emissions |
|---|---|---|---|
| 1 | China | 15,981 | 30.3% |
| 2 | United States | 6,018 | 11.4% |
| 3 | India | 4,508 | 8.5% |
| 4 | Russia | 2,574 | 4.9% |
| 5 | Indonesia | 1,359 | 2.6% |
| 6 | Brazil | 1,307 | 2.5% |
| 7 | Iran | 1,119 | 2.1% |
| 8 | Japan | 1,063 | 2.0% |
| 9 | Saudi Arabia | 845 | 1.6% |
| 10 | Canada | 765 | 1.4% |
Source: Visual Capitalist’s 2025 emissions ranking, based on EDGAR data. Mt means million metric tonnes; CO₂-equivalent expresses different greenhouse gases using a common warming-impact measure.
1. China Is the World’s Largest Greenhouse Gas Emitter
China ranks first in the 2025 emissions table, with approximately 15,981 million metric tonnes of CO₂-equivalent emissions. Its reported share is 30.3% of the global total.
China’s emissions are closely linked to its large industrial sector, electricity generation, manufacturing, and energy demand. Coal continues to play an important role in its energy system, although the country is also expanding renewable energy and nuclear power.
The transition to cleaner electricity, more efficient industrial processes, and lower-carbon transport will be important for reducing future emissions. The scale of China’s economy means that changes in its energy system can significantly influence global emissions trends.
2. The United States Ranks Second
The United States ranks second, with approximately 6,018 million metric tonnes of greenhouse gas emissions, representing 11.4% of the global total in the ranking.
Major sources include electricity generation, road transport, buildings, industry, and other economic activities. The country’s energy mix includes natural gas, oil, coal, nuclear power, wind, and solar energy.
Reducing emissions will depend on several factors, including cleaner electricity, improved vehicle efficiency, electric transport, industrial innovation, and energy-efficient buildings. Policy choices and changes in energy prices can also affect how quickly emissions decline.
3. India Ranks Third in Global Emissions
India ranks third, with approximately 4,508 million metric tonnes of CO₂-equivalent emissions and an 8.5% share of global emissions.
India’s energy demand is shaped by its growing population, urbanization, infrastructure development, manufacturing, and rising demand for electricity and transport. Coal remains an important source of electricity, while solar and other renewable energy sources are expanding.
India’s climate challenge includes supporting economic development while improving energy efficiency and reducing dependence on high-emission energy sources. Expanding clean electricity, public transport, electric mobility, and modern industrial technology could help limit future emissions growth.
It is also important to distinguish total emissions from emissions per person. A country with a large population can have high total emissions even when its average emissions per person differ considerably from those of other major emitters.
4. Russia and Indonesia Complete the Top Five
Russia ranks fourth, contributing around 4.9% of global emissions in the ranking. Its emissions are associated with energy production, industry, transport, and other activities across a large economy.
Indonesia ranks fifth, with approximately 1,359 million metric tonnes of CO₂-equivalent emissions. Its economy includes energy-intensive industries, transport, and activities connected to land use and agriculture.
The two countries illustrate why climate strategies need to address different national circumstances. Energy efficiency, cleaner electricity, methane reduction, and better management of land and industrial processes can all contribute to lowering greenhouse gas emissions.
Why Do Some Countries Produce More Emissions Than Others?
Several factors influence a country’s total greenhouse gas emissions.
Dependence on fossil fuels
Coal, oil, and natural gas release carbon dioxide when burned. Countries that rely heavily on these fuels for electricity, transport, heating, and industrial production generally face a significant emissions-reduction challenge.
Population and economic activity
Large populations require energy, housing, food, transport, and infrastructure. Industrialized economies also consume energy to manufacture goods and operate services. However, population size alone does not explain emissions: energy efficiency and the type of economic activity also matter.
Industrial production
Steel, cement, chemicals, and other industrial materials can generate substantial emissions. Cleaner production methods, electrification, material efficiency, and low-carbon technologies can help reduce the environmental impact.
Agriculture and land use
Greenhouse gas emissions are not limited to carbon dioxide. Agriculture can release methane and nitrous oxide, while land-use changes can affect carbon stored in forests and soils. The contribution of these sources depends on the emissions categories included in a dataset.
Are Global Emissions Starting to Fall?
The overall picture remains mixed. The Visual Capitalist article reports that energy-related CO₂ emissions in China fell by around 0.5% in 2025, while India’s energy-related CO₂ emissions also declined, helped by renewable electricity growth and cooler weather.
However, those specific energy-related CO₂ changes should not be confused with changes in each country’s total greenhouse gas emissions. Different datasets measure different gases, sectors, and categories.
The European Commission’s EDGAR 2026 report estimates that global greenhouse gas emissions reached 54.1 gigatonnes of CO₂-equivalent in 2025, excluding land use, land-use change, and forestry. That was an increase of approximately 0.7% compared with 2024.
This broader estimate shows that progress in individual countries or sectors does not necessarily mean global emissions are declining. Global emissions will fall sustainably only when reductions outweigh increases around the world.
How Can Countries Reduce Greenhouse Gas Emissions?
Governments, businesses, and communities can take several steps to reduce emissions:
- Expand renewable energy: Increase electricity generation from solar, wind, and other low-carbon sources.
- Improve energy efficiency: Reduce wasted energy in buildings, factories, appliances, and transport.
- Modernize transport: Improve public transport, support cleaner vehicles, and develop infrastructure for walking and cycling.
- Cut industrial emissions: Adopt cleaner production processes and develop lower-carbon alternatives for materials such as steel and cement.
- Reduce methane emissions: Improve waste management and address methane leaks from energy systems and other sources.
- Protect forests: Prevent deforestation and improve land management where relevant.
- Measure progress transparently: Use consistent data and clearly defined targets to track emissions over time.
No single measure can solve the problem. A combination of clean energy, efficient technology, effective policy, and international cooperation is needed.
Why the 2025 Emissions Ranking Matters
Country rankings help readers understand where greenhouse gas emissions are concentrated. They can also provide a starting point for discussions about energy policy, industrial development, climate finance, and international cooperation.
However, rankings should not be used alone to judge a country’s climate performance. Total emissions, emissions per person, historical emissions, and the emissions associated with imported and exported goods can tell different stories.
The figures also depend on the dataset’s scope and methodology. Comparisons are most useful when countries are measured using the same definitions and the same reporting period.
Frequently Asked Questions (FAQs)
1. Which country produced the most greenhouse gas emissions in 2025?
China ranked first in the Visual Capitalist ranking, with approximately 15,981 million metric tonnes of CO₂-equivalent emissions and 30.3% of the global total.
2. Which countries ranked in the top three for global emissions in 2025?
China ranked first, the United States second, and India third. Together, they accounted for approximately 50.2% of global emissions in the ranking.
3. What was India’s share of global emissions in 2025?
India accounted for approximately 8.5% of global greenhouse gas emissions in the ranking, with an estimated 4,508 million metric tonnes of CO₂-equivalent emissions.
4. What does CO₂-equivalent mean?
CO₂-equivalent is a standard unit that expresses the warming impact of different greenhouse gases in terms of the amount of carbon dioxide that would have a comparable impact over a specified period.
5. Are greenhouse gas emissions the same as carbon dioxide emissions?
No. Greenhouse gas emissions include carbon dioxide, methane, nitrous oxide, and fluorinated gases. A ranking of total greenhouse gases is broader than one that measures carbon dioxide alone.
6. Did global greenhouse gas emissions fall in 2025?
No. The European Commission’s EDGAR 2026 report estimates that global greenhouse gas emissions increased by about 0.7% in 2025, reaching 54.1 gigatonnes of CO₂-equivalent, excluding land use, land-use change, and forestry.
7. Why is China responsible for such a large share of global emissions?
China’s large industrial base, electricity demand, manufacturing activity, and reliance on fossil fuels contribute to its high total emissions. Its size and role in global manufacturing also affect the overall figure.
8. How can readers check official emissions data?
Readers can consult the European Commission’s EDGAR database for country-level greenhouse gas estimates and methodology information. The Visual Capitalist ranking provides a visual summary of the 2025 comparison.
Conclusion
The 2025 global emissions ranking shows that China, the United States, and India account for a substantial share of worldwide greenhouse gas emissions. Russia and Indonesia also rank among the largest emitters, while other major economies contribute significant amounts.
The figures underline the importance of cleaner energy, more efficient industries, improved transport, and transparent emissions reporting. At the same time, readers should consider the difference between total emissions and emissions per person when comparing countries.
Tracking these numbers consistently can help governments, businesses, and the public understand whether climate action is delivering meaningful progress.
