


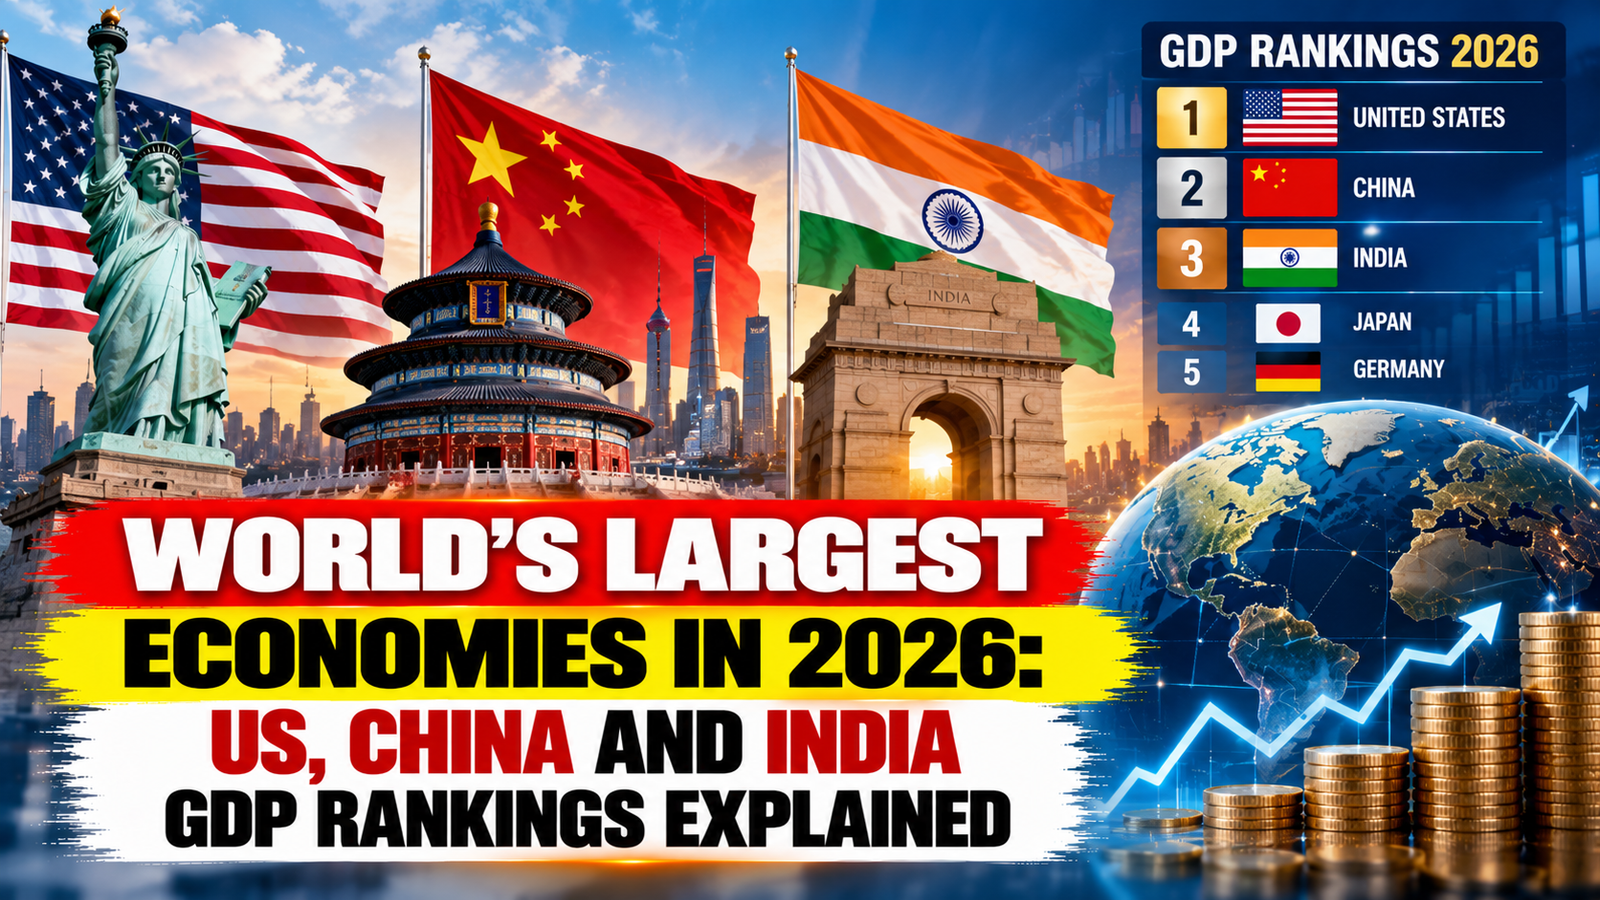
The world’s largest economies in 2026 show how economic power is distributed between developed nations and emerging markets. According to projections from the International Monetary Fund (IMF), the United States remains the world’s largest economy by nominal gross domestic product (GDP), followed by China. Germany, Japan, the United Kingdom and India also rank among the leading economies.
However, the rankings change significantly when GDP is measured using purchasing power parity (PPP). Under this method, China ranks first, the United States second and India third, reflecting differences in the cost of goods and services between countries.
The distinction matters because nominal GDP and PPP measure different aspects of economic activity. Nominal GDP is useful for comparing output at market exchange rates, while PPP helps explain how much goods and services an economy can produce or purchase at local prices.
The 2026 figures discussed in this article are IMF projections, not final annual GDP results.
What Are the World’s Largest Economies in 2026?
The United States leads the global economy by nominal GDP, with projected output of approximately $32.64 trillion in 2026. China ranks second at around $21.55 trillion.
Germany occupies third place, followed by Japan and the United Kingdom. India ranks sixth by nominal GDP in the October 2026 projections cited by Visual Capitalist.
Top 10 Economies by Nominal GDP in 2026
| Rank | Country | Projected GDP |
|---|---|---|
| 1 | United States | $32.64 trillion |
| 2 | China | $21.55 trillion |
| 3 | Germany | $5.47 trillion |
| 4 | Japan | $4.34 trillion |
| 5 | United Kingdom | $4.27 trillion |
| 6 | India | $4.06 trillion |
| 7 | France | $3.55 trillion |
| 8 | Russia | $2.86 trillion |
| 9 | Italy | $2.70 trillion |
| 10 | Brazil | $2.65 trillion |
Source: IMF October 2026 World Economic Outlook projections, as reported by Visual Capitalist. Figures are rounded.
The gap between the United States and China is substantial in nominal terms. The US economy is projected to be worth approximately $11.10 trillion more than China’s in 2026.
Germany is a distant third, with projected output of about $5.47 trillion. This illustrates the scale of the two largest economies relative to other countries.
Why Is the United States the World’s Largest Economy?
The United States continues to lead the nominal GDP ranking because of the size and diversity of its economy.
Its economic activity spans technology, finance, healthcare, manufacturing, retail, energy, entertainment and professional services. The country also has large capital markets, major multinational corporations and a substantial consumer market.
Several factors contribute to the scale of the US economy:
- Consumer spending: Household consumption supports a wide range of businesses and services.
- Technology: American companies play a major role in software, cloud computing, artificial intelligence and digital services.
- Financial markets: Deep capital markets help businesses raise funds and support investment.
- Services: Finance, healthcare, education, professional services and other industries contribute significantly to output.
- Energy and manufacturing: The country has large energy resources and an extensive industrial base.
Nominal GDP also depends on exchange rates. Changes in the dollar’s value can affect comparisons with other economies even when domestic production changes at a different rate.
China Remains the World’s Second-Largest Economy by Nominal GDP
China ranks second by nominal GDP in the 2026 projections, with output estimated at approximately $21.55 trillion.
Its economic scale reflects decades of industrial development, investment in infrastructure, manufacturing capacity and integration into international trade.
China is a major producer of electronics, machinery, vehicles, industrial equipment and consumer goods. It also has a large domestic market and extensive supply-chain connections with other countries.
The economy faces challenges, including property-sector pressures, demographic changes and the need to sustain domestic demand. Nevertheless, its manufacturing capacity and global trade relationships remain important sources of economic activity.
China’s position changes when GDP is adjusted for purchasing power. Because many goods and services cost less domestically than in the United States, the PPP measure places China’s total economic output significantly higher.
India GDP Ranking in 2026: Why It Matters
India ranks sixth in the IMF’s October 2026 nominal GDP projections, with an estimated economy of approximately $4.06 trillion.
Although India’s nominal ranking is below those of Germany, Japan and the United Kingdom, its position rises substantially when GDP is measured using purchasing power parity.
India’s PPP-adjusted GDP is projected at approximately $19.19 trillion, placing it third globally, behind China and the United States.
This difference reflects the scale of India’s domestic economy and the lower prices of many goods and services compared with advanced economies.
Key Factors Supporting India’s Economic Scale
1. Large domestic market
India’s population of more than 1.4 billion people creates demand for food, housing, transport, healthcare, education and consumer products. Domestic consumption is an important part of economic activity.
2. Services industry
Information technology, business services, finance, telecommunications and other service industries contribute to India’s economic output and international trade.
3. Infrastructure development
Investment in roads, railways, ports, airports, electricity and digital infrastructure can support productivity and connect businesses with customers and markets.
4. Manufacturing opportunities
India has sought to expand manufacturing in sectors such as electronics, automobiles, pharmaceuticals and industrial equipment. The long-term contribution of these efforts depends on investment, productivity, demand and global competition.
5. Digital adoption
Digital payments, online services and expanding internet access have changed how many Indian businesses operate and reach consumers.
India’s future position in the global rankings will depend on sustained productivity growth, investment, employment, inflation, exchange rates and changes in the economies of other countries.
What Is Nominal GDP?
Nominal gross domestic product measures the value of all final goods and services produced within a country during a specific period, using current prices.
For international comparisons, nominal GDP is generally converted into US dollars using market exchange rates.
This measure is useful for comparing the size of national economies in international financial terms. It can help analysts examine the scale of domestic markets, economic output and the relative size of countries at current exchange rates.
However, nominal GDP has limitations. Exchange-rate movements can change a country’s dollar-denominated GDP even when the volume of goods and services produced domestically changes much less.
Inflation also affects nominal GDP because it uses current prices rather than adjusting fully for price changes.
What Is Purchasing Power Parity (PPP)?
Purchasing power parity is a method of comparing economies that accounts for differences in the prices of goods and services across countries.
For example, the same amount of money can buy different quantities of food, housing, transport and services in different economies. PPP attempts to adjust for these differences to make comparisons of domestic economic output more meaningful.
This approach often increases the measured size of economies where local prices are relatively low.
China ranks first by PPP GDP in the 2026 projections, followed by the United States and India.
Top 10 Economies by PPP GDP in 2026
| Rank | Country | Projected PPP GDP |
|---|---|---|
| 1 | China | $44.55 trillion |
| 2 | United States | $32.64 trillion |
| 3 | India | $19.19 trillion |
| 4 | Russia | $7.54 trillion |
| 5 | Japan | $7.32 trillion |
| 6 | Germany | $6.55 trillion |
| 7 | Indonesia | $5.48 trillion |
| 8 | Brazil | $5.27 trillion |
| 9 | United Kingdom | $4.78 trillion |
| 10 | France | $4.76 trillion |
Source: IMF October 2026 World Economic Outlook projections, as reported by Visual Capitalist. PPP figures are expressed in international dollars and rounded.
PPP rankings are useful for comparing the relative scale of domestic production and consumption. They do not mean that a country has the same level of international purchasing power, financial-market influence or household income as another country with a similar PPP GDP.
Why Does India’s Ranking Rise Under PPP?
India rises from sixth place by nominal GDP to third place by PPP GDP.
The main reason is the difference between domestic prices and market exchange rates. Many goods and services cost less in India than in advanced economies, so the same amount of money can purchase more locally.
India’s large population also contributes to the overall scale of domestic economic activity. Spending on food, housing, transportation and services adds up across a very large market.
However, a high total GDP does not automatically mean that the average citizen is wealthy. Total GDP measures the size of an economy, while GDP per capita divides output by population and offers a different perspective on average economic output.
Income distribution, access to services, employment quality and the cost of living are also important when evaluating living standards.
Indonesia Makes a Major Jump in the PPP Ranking
Indonesia is another notable example of how rankings change under PPP.
The country ranks 17th by nominal GDP in the 2026 projections, with output of approximately $1.48 trillion. By PPP, it rises to seventh place, with an estimated $5.48 trillion in international dollars.
Indonesia’s large domestic market is one reason for this change. As the world’s fourth-most populous country, it has substantial demand for household goods, transport, food, accommodation and other services.
Its economy also includes manufacturing and commodity-related industries, with exports such as palm oil and base metals contributing to economic activity.
The PPP ranking reflects the purchasing power of domestic output, not a sudden increase in the country’s internationally traded financial resources.
How Do the Largest Economies Influence the Global Economy?
The world’s largest economies affect international trade, investment, employment and financial markets.
Their decisions can influence commodity prices, supply chains, interest-rate expectations and the direction of international business investment.
Trade and Manufacturing
The United States and China are major participants in global trade. Changes in their trade policies or industrial output can affect manufacturers and suppliers across Asia, Europe and other regions.
Germany and Japan remain important industrial economies, while India and Indonesia are significant emerging markets with large domestic consumer bases.
Financial Markets
Changes in the economic outlook for large countries can influence currency markets, bond yields, equity prices and investment flows.
The United States has a particularly important role because the dollar is widely used in international trade and finance.
Energy and Commodities
Large economies consume substantial quantities of energy and raw materials. Changes in their industrial activity can affect demand for oil, natural gas, metals and agricultural products.
For energy-importing countries, higher commodity prices can increase production costs and inflationary pressure.
Technology and Innovation
Investment in research, digital infrastructure and advanced manufacturing can influence long-term productivity and international competitiveness.
The distribution of technology-related investment may therefore shape future economic rankings, although the impact varies across industries and countries.
Does the Largest GDP Mean the Richest Country?
No. The largest economy by total GDP is not necessarily the country with the highest average income or standard of living.
Total GDP measures the value of economic output produced within a country. GDP per capita divides that output by the population.
A country with a large population can have a high total GDP even if its average output per person is much lower than that of a smaller, wealthier country.
Other measures, including median household income, productivity, health, education and cost of living, can provide additional information about living standards.
Similarly, PPP-adjusted GDP is useful for comparing domestic purchasing power, but it should not be treated as a direct measure of individual wealth.
Conclusion
The world’s largest economies in 2026 demonstrate why the choice of GDP measure matters. The United States leads by nominal GDP, followed by China, while India ranks sixth in the IMF’s October 2026 projections.
When measured using purchasing power parity, China moves to first place, the United States ranks second and India takes third. Indonesia also rises significantly, highlighting the importance of domestic prices and the size of consumer markets.
Both measures provide useful information, but they answer different questions. Nominal GDP helps compare economic output at market exchange rates, while PPP offers a better way to compare the relative purchasing power of domestic production.
The rankings are projections rather than final annual results. Future positions will depend on economic growth, inflation, exchange rates, productivity and changes in global demand.
Frequently Asked Questions (FAQs)
1. Which is the world’s largest economy in 2026?
The United States is projected to be the world’s largest economy by nominal GDP in 2026, with output of approximately $32.64 trillion.
2. Which country ranks second by nominal GDP?
China ranks second, with projected nominal GDP of approximately $21.55 trillion.
3. What is India’s GDP ranking in 2026?
India ranks sixth by nominal GDP in the IMF’s October 2026 projections. It ranks third when GDP is measured using purchasing power parity.
4. Which country has the largest economy by PPP in 2026?
China ranks first by purchasing power parity, with projected output of approximately $44.55 trillion in international dollars.
5. What is the difference between nominal GDP and PPP GDP?
Nominal GDP compares output at current market exchange rates. PPP GDP adjusts for differences in local prices, helping compare the purchasing power of domestic output.
6. Why does India rank higher under PPP?
Many goods and services cost less in India than in advanced economies. Adjusting for those price differences increases India’s measured share of global economic activity.
7. Does a larger GDP mean people are richer?
Not necessarily. Total GDP measures the size of an economy, while GDP per capita and other indicators provide more information about average income and living standards.
